| FAQ | |
|
Home |
What
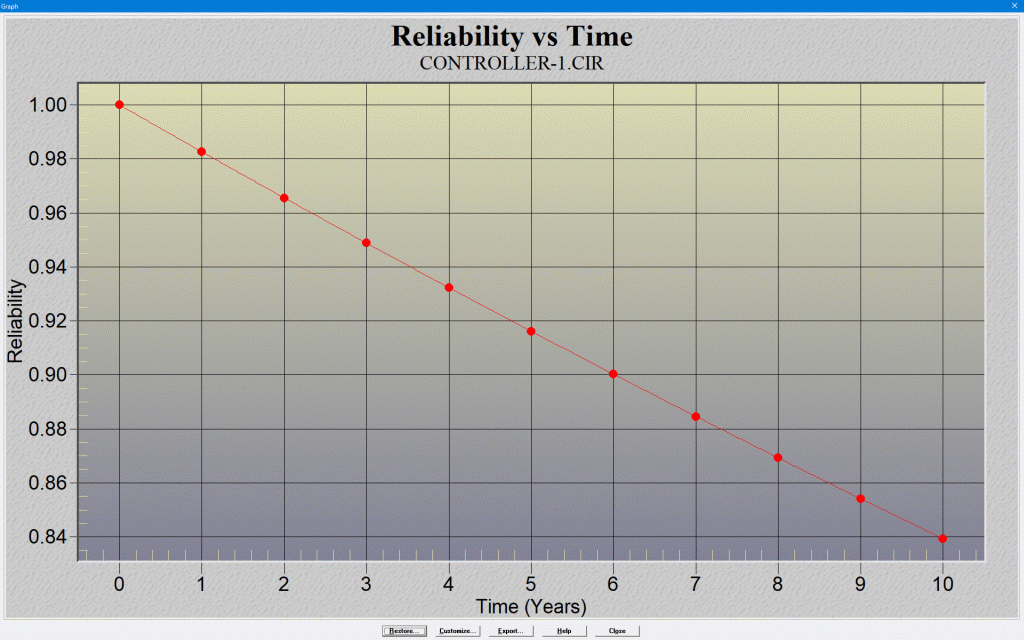
is MTBF? MTBF is an abbreviation for Mean Time Between Failures. MTBF is a measure of how reliable a product is. MTBF is usually given in units of hours; the higher the MTBF, the more reliable the product is. For electronic products, it is commonly assumed that during the useful operating life period the parts have constant failure rates, and part failure rates follow an exponential law of distribution. In this case, the MTBF of the product can be calculated as: MTBF = 1/(sum of all the part failure rates) The MTBF figure for a product can be derived in various ways: using lab test data, using actual field failure data, or using part failure rate prediction models (such as Telcordia SR-332 or MIL-HDBK-217). The RelCalc for Windows software can help you do your MTBF prediction. Reliability: A Better Metric? MTBF is an often misinterpreted and misleading metric. For example, let's say a unit has MTBF = 500,000 hours, which is approximately 57 years of 24x7 operation. Many people will see this and think that there will be no failures in 57 years: wrong! The math actually works out like this: ~ 2/3 of the units have failed by the time operating time = MTBF time. A better metric is Reliability (R). Reliability is the probability that the unit will operate without failure for the given time. Note that the time is actual unit operating time, not calendar time. Note: the Reliability calculation assumes replacement upon failure. Reliability (R), which is the probability that the unit will work for some time T without failure, is given by: R(T) = exp(-T/MTBF) Thus, for a unit with an MTBF of 500,000 hours, and an operating time of interest of 5 years of 24x7 (43,800 hours): R = exp(-43800/500000) = 0.916127 This tells you that there is a 91.6% probability that the unit will operate for the 5 years without a failure, or that 91.6% of the units in the field will still be working at the 5 year point. Thus, if you have 1000 units in the field, this calculation estimates that 916 will still be working (84 will have failed) at the 5 year point. Note: the Reliability calculation assumes replacement upon failure. The Reliability metric gives you a reality check for your MTBF results: does this match up with your experience of how often the units are failing in the field? Are these predicted probabilities consistent with your product warranty time? Note that the RelCalc software allows you to generate a "Reliability vs Time" graph, which shows you the Reliability values over a range of Time, based on the MTBF calculation for your product.  The screen shot above shows the RelCalc "Reliability vs Time" graph for an example with MTBF = 500,000 hours. You can see that the Reliability value is ~ 0.916 at Time = 5 years (24x7). If your product is not powered on 24x7, the graph still allows you to easily get results. For example, let's say that your product is powered on 12 hours/day, 5 days/week. After 5 calendar years, the product's operating hours = 12 hours/day * 5 days/week * 52 weeks/year * 5 years = 15,600 hours. Thus, with MTBF = 500,000 hours, and an operating time of 15,600 hours: R = exp(-15,600/500000) = 0.969282 To see that on the graph above: 15,600 hours ~ 1.78 years (24x7); look at the graph's Reliability value at Time ~ 1.78 years, which is ~ 0.97. Thus, after 5 years calendar time (1.78 years actual product operating time), for every 1000 units in the field, this calculation estimates that 970 will still be working (30 will have failed). |